Tutorial
The pyvis library is meant for quick generation of visual network graphs with minimal python code. It is designed as a wrapper around the popular Javascript visJS library found at this link.
Getting started
All networks must be instantiated as a Network class instance
>>> from pyvis.network import Network
>>> net = Network()
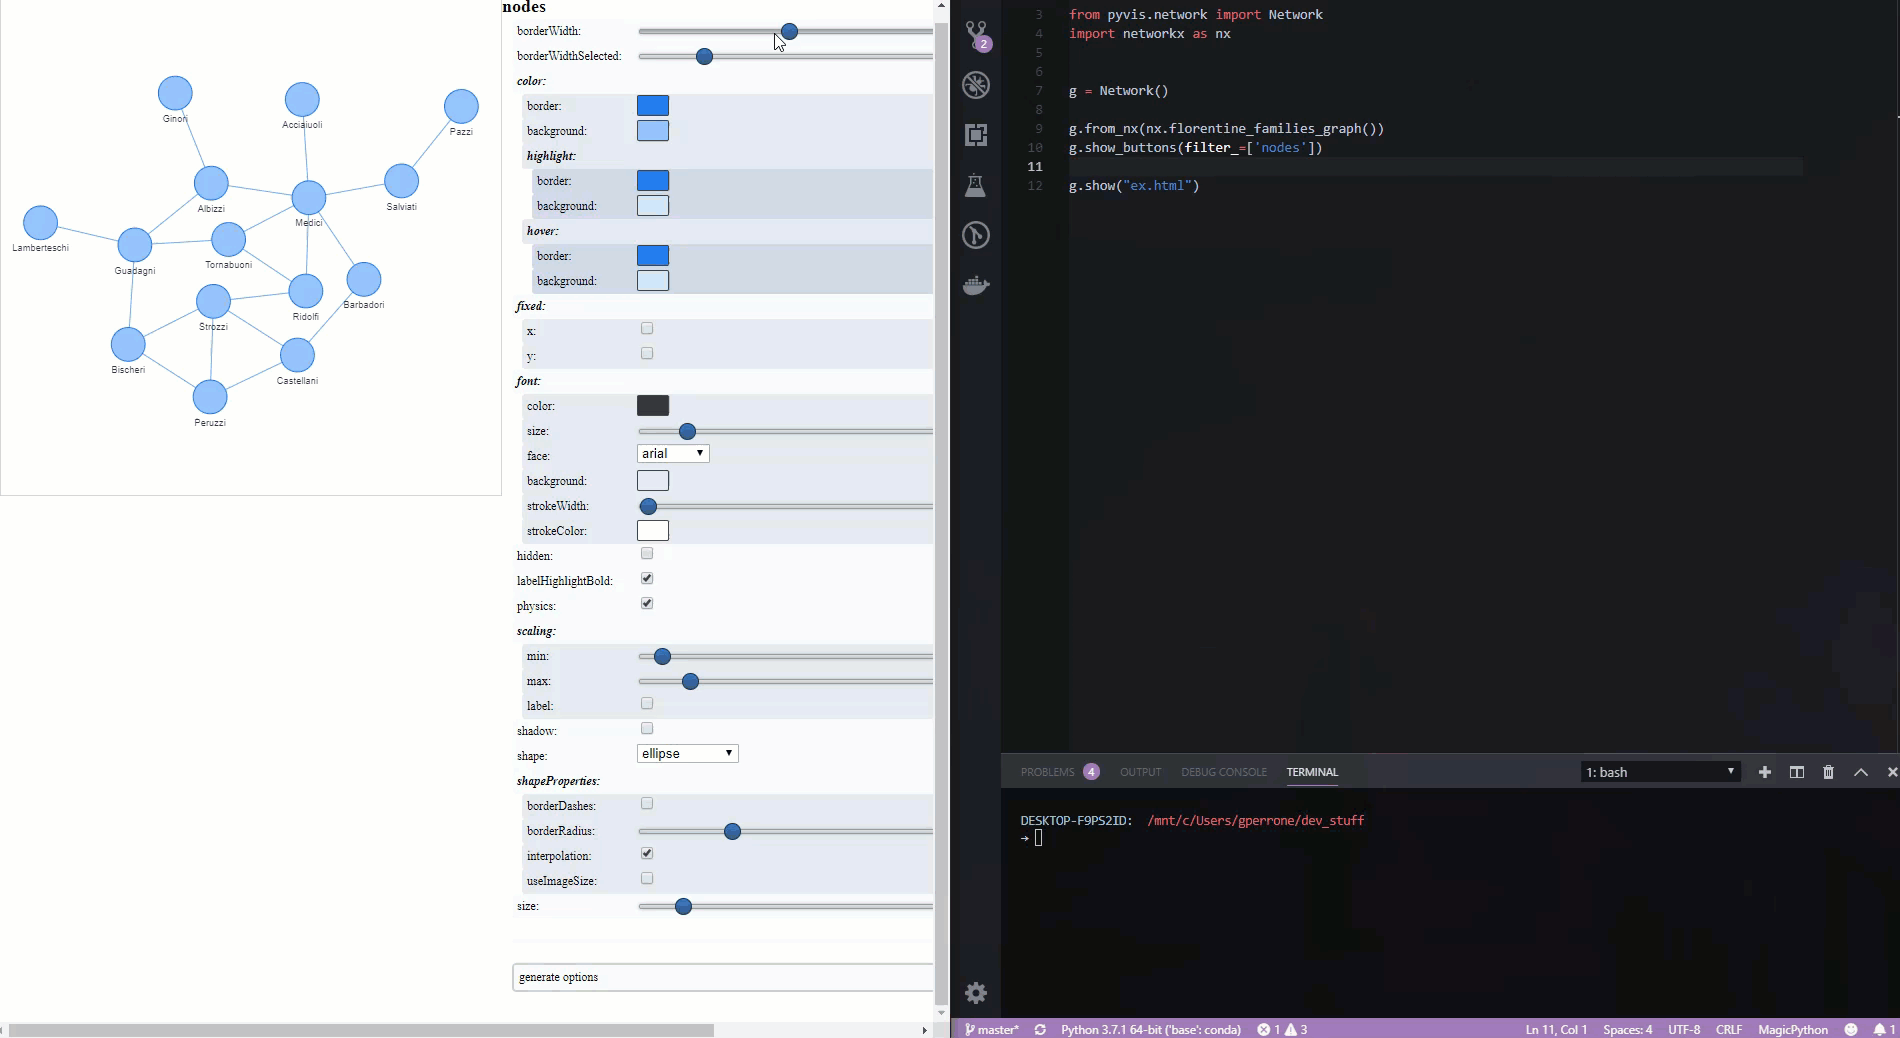
Add nodes to the network
>>> net.add_node(1, label="Node 1") # node id = 1 and label = Node 1
>>> net.add_node(2) # node id and label = 2
Here, the first parameter to the add_node method is the desired ID to give the Node. This can be a string or a numeric. The label argument is the string that will be visibly attached to the node in the final visualization. If no label argument is specified then the node id will be used as a label.
Note
The ID parameter must be unique
You can also add a list of nodes
>>> nodes = ["a", "b", "c", "d"]
>>> net.add_nodes(nodes) # node ids and labels = ["a", "b", "c", "d"]
>>> net.add_nodes("hello") # node ids and labels = ["h", "e", "l", "o"]
Note
network.Network.add_nodes() accepts any iterable as long as the contents are strings or numerics
Node properties
A call to add_node() supports various node properties that can be set
individually. All of these properties can be found here, courtesy of VisJS.
For the direct Python translation of these attributes, reference the
network.Network.add_node() docs.
Indexing a Node
Use the get_node() method to index a node by its ID:
>>> net.add_nodes(["a", "b", "c"])
>>> net.get_node("c")
>>> {'id': 'c', 'label': 'c', 'shape': 'dot'}
Adding list of nodes with properties
When using the network.Network.add_nodes() method optional keyword arguments can be
passed in to add properties to these nodes as well. The valid properties in this case are
>>> ['size', 'value', 'title', 'x', 'y', 'label', 'color']
Each of these keyword args must be the same length as the nodes parameter to the method.
Example:
>>> g = Network()
>>> g.add_nodes([1,2,3], value=[10, 100, 400],
                         title=['I am node 1', 'node 2 here', 'and im node 3'],
                         x=[21.4, 54.2, 11.2],
                         y=[100.2, 23.54, 32.1],
                         label=['NODE 1', 'NODE 2', 'NODE 3'],
                         color=['#00ff1e', '#162347', '#dd4b39'])
Note
If you mouse over each node you will see that the title of a node
attribute is responsible for rendering data on mouse hover. You can add HTML
in your title string and it will be rendered as such.
Note
The color attribute can also be a plain HTML color like red or blue. You can also
specify the full rgba specification if needed. The VisJS documentation has more
details.
Detailed optional argument documentation for nodes are in the
network.Network.add_node() method documentation.
Edges
Assuming the network’s nodes exist, the edges can then be added according to node id’s
>>> net.add_node(0, label='a')
>>> net.add_node(1, label='b')
>>> net.add_edge(0, 1)
Edges can contain a weight attribute as well
>>> net.add_edge(0, 1, weight=.87)
Edges can be customized and documentation on options can be found at
network.Network.add_edge() method documentation, or by referencing the
original VisJS edge module docs.
Networkx integration
An easy way to visualize and construct pyvis networks is to use Networkx
and use pyvis’s built-in networkx helper method to translate the graph. Note that the
Networkx node properties with the same names as those consumed by pyvis (e.g., title) are
translated directly to the correspondingly-named pyvis node attributes.
>>> from pyvis.network import Network
>>> import networkx as nx
>>> nx_graph = nx.cycle_graph(10)
>>> nx_graph.nodes[1]['title'] = 'Number 1'
>>> nx_graph.nodes[1]['group'] = 1
>>> nx_graph.nodes[3]['title'] = 'I belong to a different group!'
>>> nx_graph.nodes[3]['group'] = 10
>>> nx_graph.add_node(20, size=20, title='couple', group=2)
>>> nx_graph.add_node(21, size=15, title='couple', group=2)
>>> nx_graph.add_edge(20, 21, weight=5)
>>> nx_graph.add_node(25, size=25, label='lonely', title='lonely node', group=3)
>>> nt = Network('500px', '500px')
# populates the nodes and edges data structures
>>> nt.from_nx(nx_graph)
>>> nt.show('nx.html')
Visualization
The displaying of a graph is achieved by a single method call on
network.Network.show() after the underlying network is constructed.
The interactive visualization is presented as a static HTML file.
>>> net.toggle_physics(True)
>>> net.show('mygraph.html')
Note
Triggering the toggle_physics() method allows for more fluid graph interactions
Example: Visualizing a Game of Thrones character network
The following code block is a minimal example of the capabilities of pyvis.
from pyvis.network import Network
import pandas as pd

got_net = Network(height="750px", width="100%", bgcolor="#222222", font_color="white")

# set the physics layout of the network
got_net.barnes_hut()
got_data = pd.read_csv("../../notebooks/NetworkOfThrones.csv")

sources = got_data['Source']
targets = got_data['Target']
weights = got_data['Weight']

edge_data = zip(sources, targets, weights)

for e in edge_data:
                src = e[0]
                dst = e[1]
                w = e[2]

                got_net.add_node(src, src, title=src)
                got_net.add_node(dst, dst, title=dst)
                got_net.add_edge(src, dst, value=w)

neighbor_map = got_net.get_adj_list()

# add neighbor data to node hover data
for node in got_net.nodes:
                node["title"] += " Neighbors:<br>" + "<br>".join(neighbor_map[node["id"]])
                node["value"] = len(neighbor_map[node["id"]])

got_net.show("gameofthrones.html")
If you want to try out the above code, the csv data source can be downloaded
Note
The title attribute of each node is responsible for rendering data on node hover.
Using the configuration UI to dynamically tweak Network settings
You also have the option of supplying your visualization with a UI used to dynamically alter some of the settings pertaining to your network. This could be useful for finding the most optimal parameters to your graph’s physics and layout function.
>>> net.show_buttons(filter_=['physics'])
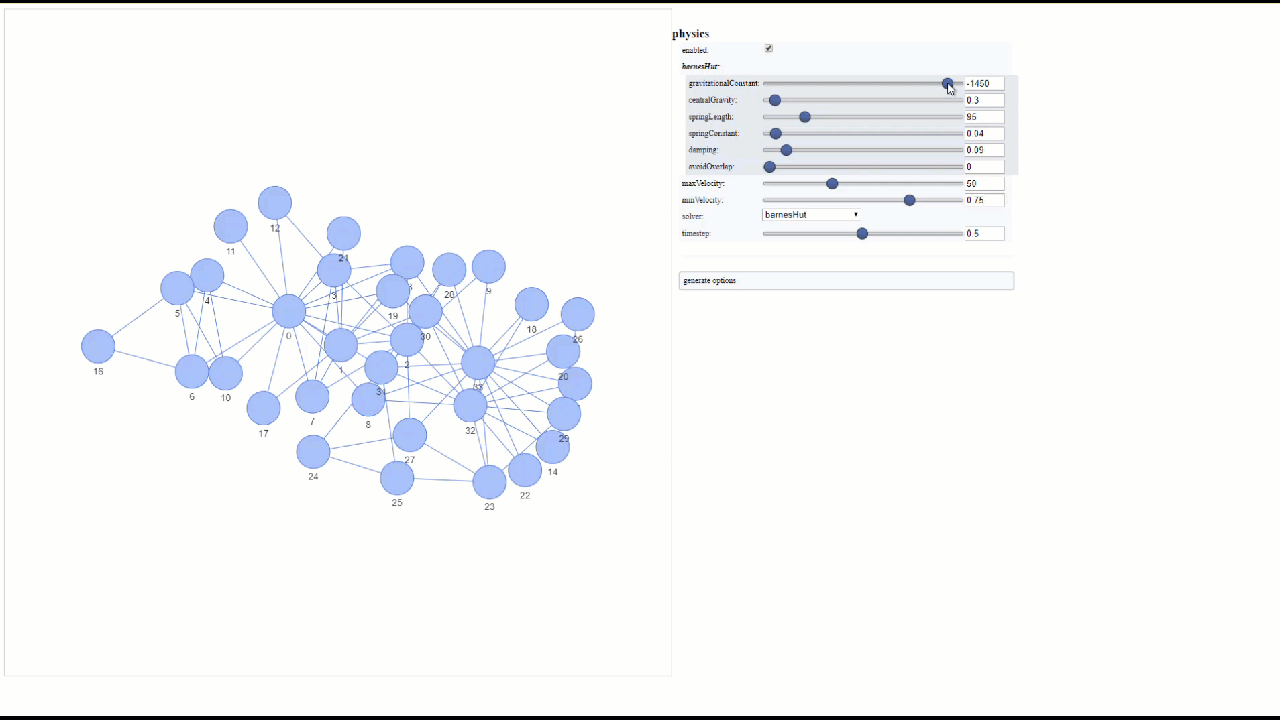
Note
You can copy/paste the output from the generate options button in the above UI
into network.Network.set_options() to finalize your results from experimentation
with the settings.
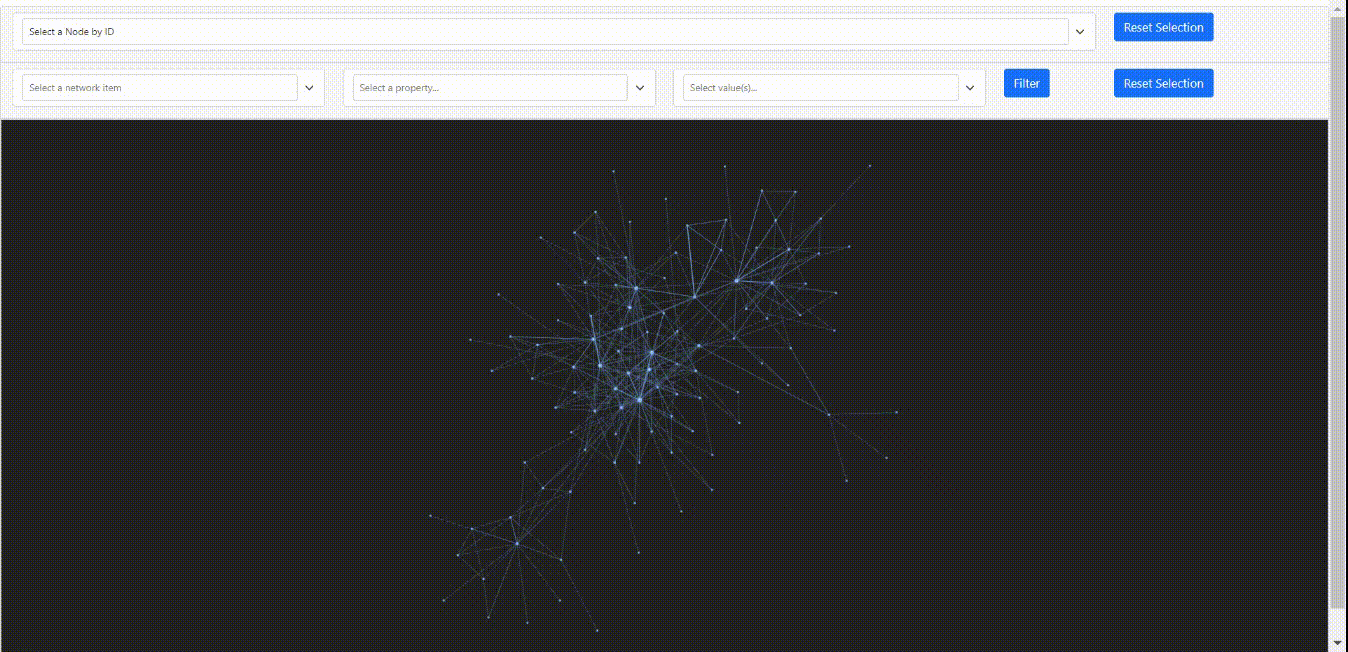
Filtering and Highlighting the nodes
You can highlight a node and its neighboring edges and nodes by clicking on the node or choosing the drop down above when select_menu option is set as True. The selected node and its neighbours will be highlighted while the rest of the network is greyed out.
>>> got_net = Network(height="750px", width="100%", bgcolor="#222222", font_color="white", select_menu=True)
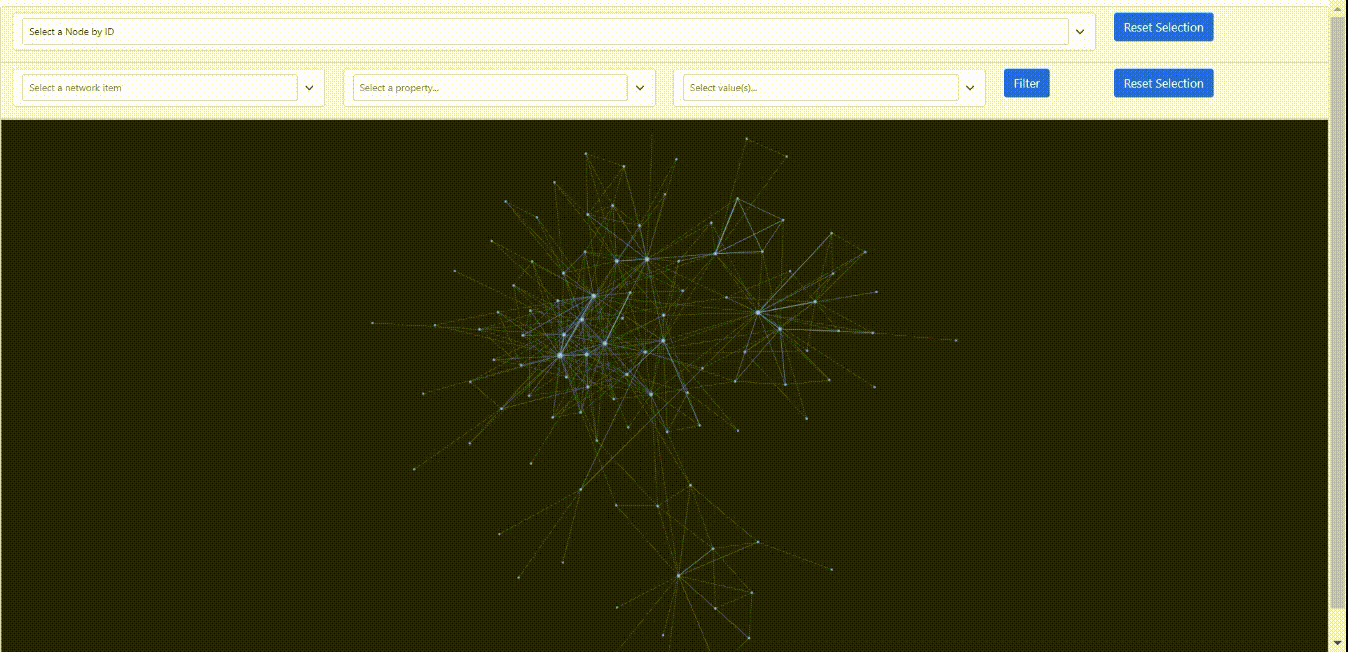
You can also filter on certain objects of the network like nodes and edges. You can activate this feature by passing filter_menu option as True. With this option turned on, you can build a query choosing edges or nodes, then choosing the attribute to filter on and finally a value or multiple values to filter. When you filter on nodes, the selected node will be highlighted and rest of the network will be hidden. If the selected nodes are connected the edges will also be highlighted. When you filter on edges, the nodes connecting them will be highlighted along with the edges.
>>> got_net = Network(height="750px", width="100%", bgcolor="#222222", font_color="white", filter_menu=True)
Note
You can use these two features independently and can also combine them to get a customized view of the network
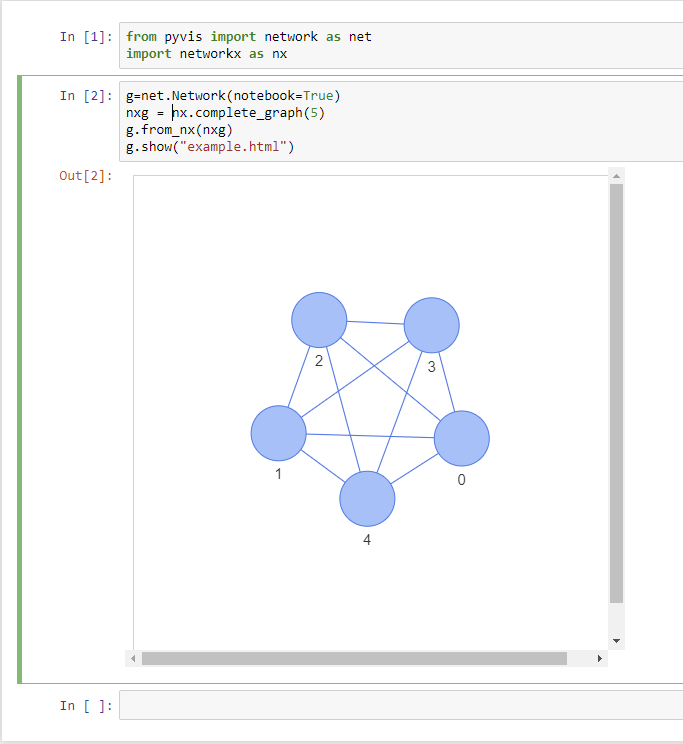
Using pyvis within Jupyter notebook
Pyvis supports Jupyter notebook embedding through the
use of the
network.Network() constructor. The network instance must be
“prepped” during instantiation by supplying the notebook=True kwarg.
Example:
Note
while using notebook in chrome browser, to render the graph, pass additional kwarg ‘cdn_resources’ as ‘remote’ or ‘inline’